Data Visualization

What is data visualization?
Data visualization is the practice of turning raw data into visual elements such as charts, graphs, maps, or dashboards. This makes complex information easier to understand, helps reveal patterns and trends, and supports clearer decision-making.
Deliverables
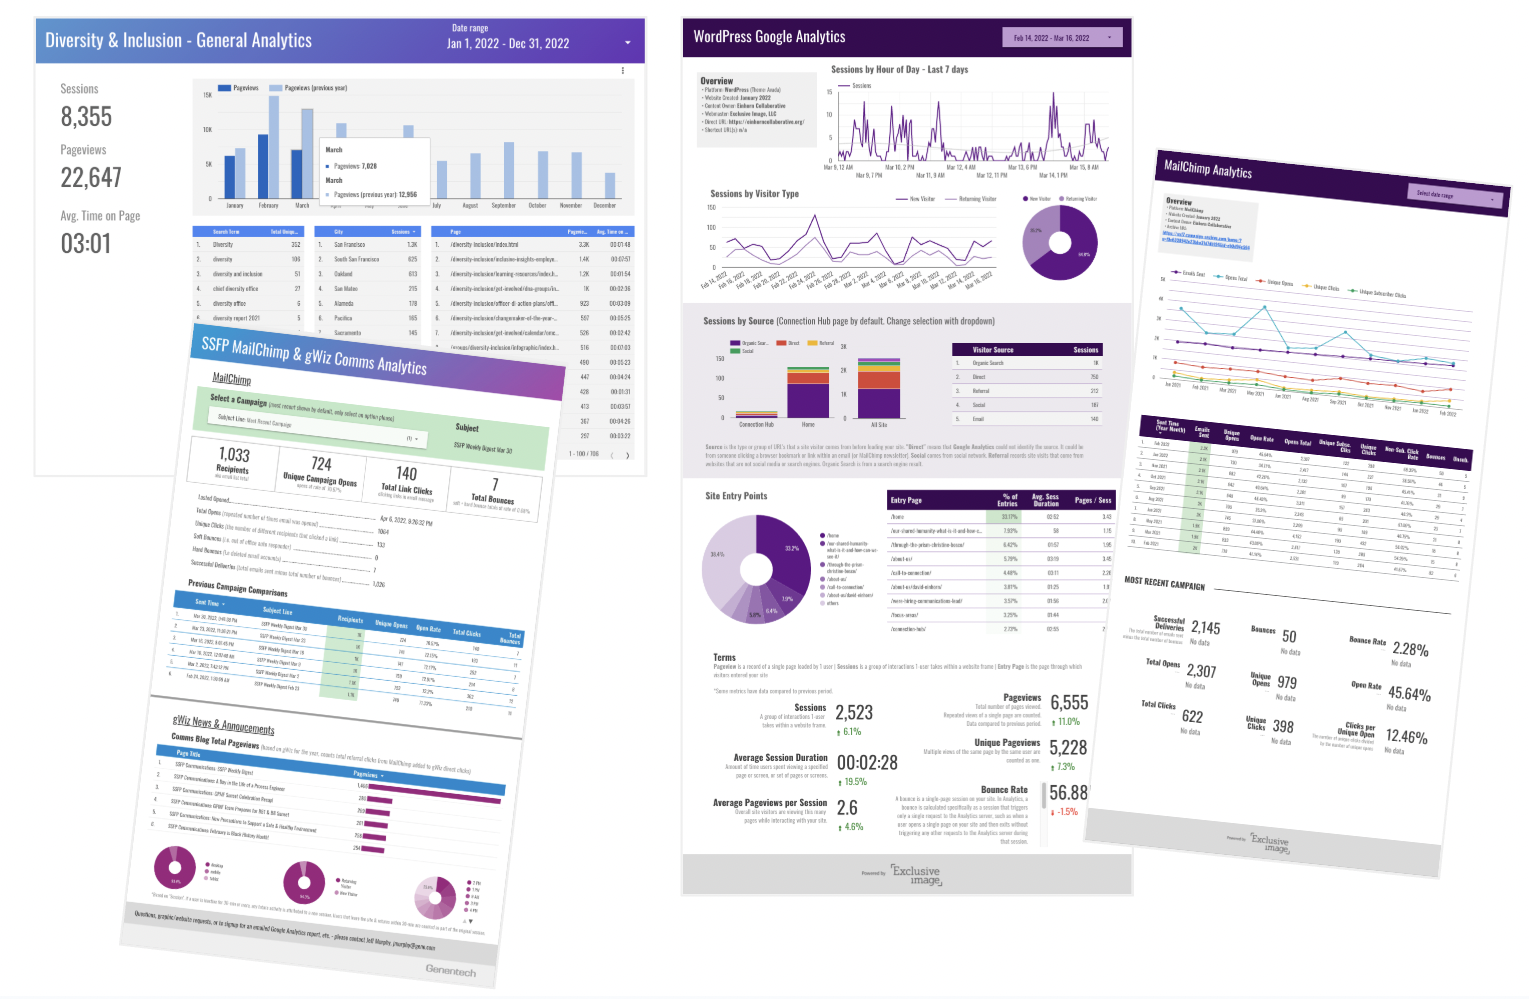
By drawing from a variety of data sources, designed a comms strategy that effectively conveys a meaningful story through the data, brought to life in an interactive visual dashboard.
- Web
- Graphics
Interactive Dashboards